The purpose of the page as it stands now is to provide quick visualization as I work out some querying and filtering functionality but I plan on making this a single page application in the future.
You can view my code as it develops here:
https://github.com/jcere/Telemetry/tree/master/Telemetry.Service/Views
Right now I'm working on a few data sampling methods for my controller. So far I'm thinking of being able to query and alter the display based on: start time, number of samples or time span, and by limiting the frequency.
I've been introduced to a few very smart tools while working on this, one really nice tool I used to test these methods is Postman; it's available from the Chrome Web Store. Postman is an Http request builder to 'Build, test, and document your APIs faster.' With Postman you can build a full Http request from a given URL and a number of other settings, and then send the request and display the response.
What's really handy for me is being able to see all of the components of the request, I found being able to view the headers and request body, gave me a much better sense of what is going on behind the scenes during this exchange. Postman allows you to build multiple requests in collections and save them for testing later.
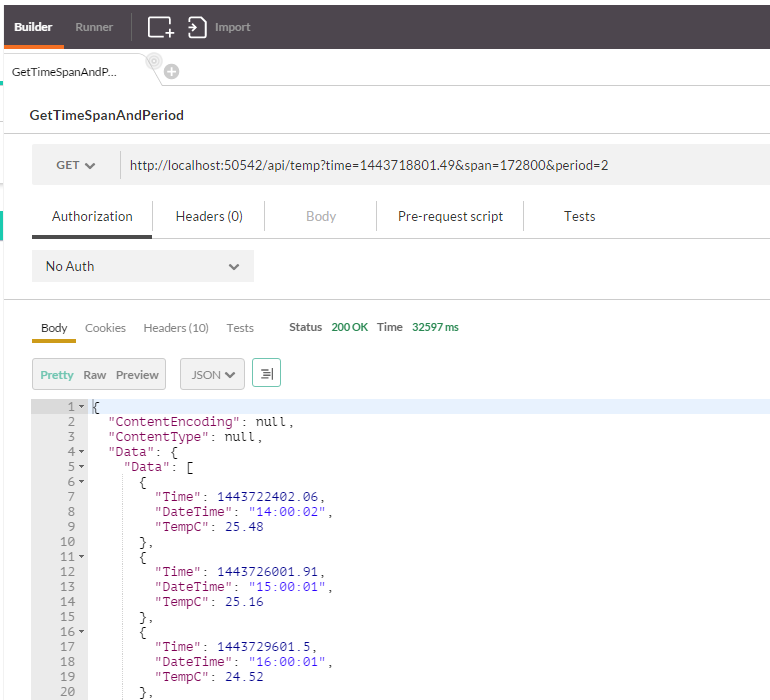
Here you can see I entered my URL with some additional arguments for start time, time span, and period. So my code should return data with a period of 2 (or a frequency of 1/2 samples per hour) and from the JSON in the response body I can see I didn't get that, but that is what I was going for :)
Anyway, very nice tool and easy to use, I'm going to go fix my code now.
No comments:
Post a Comment